View Modules
Circos Plot / Feature Table
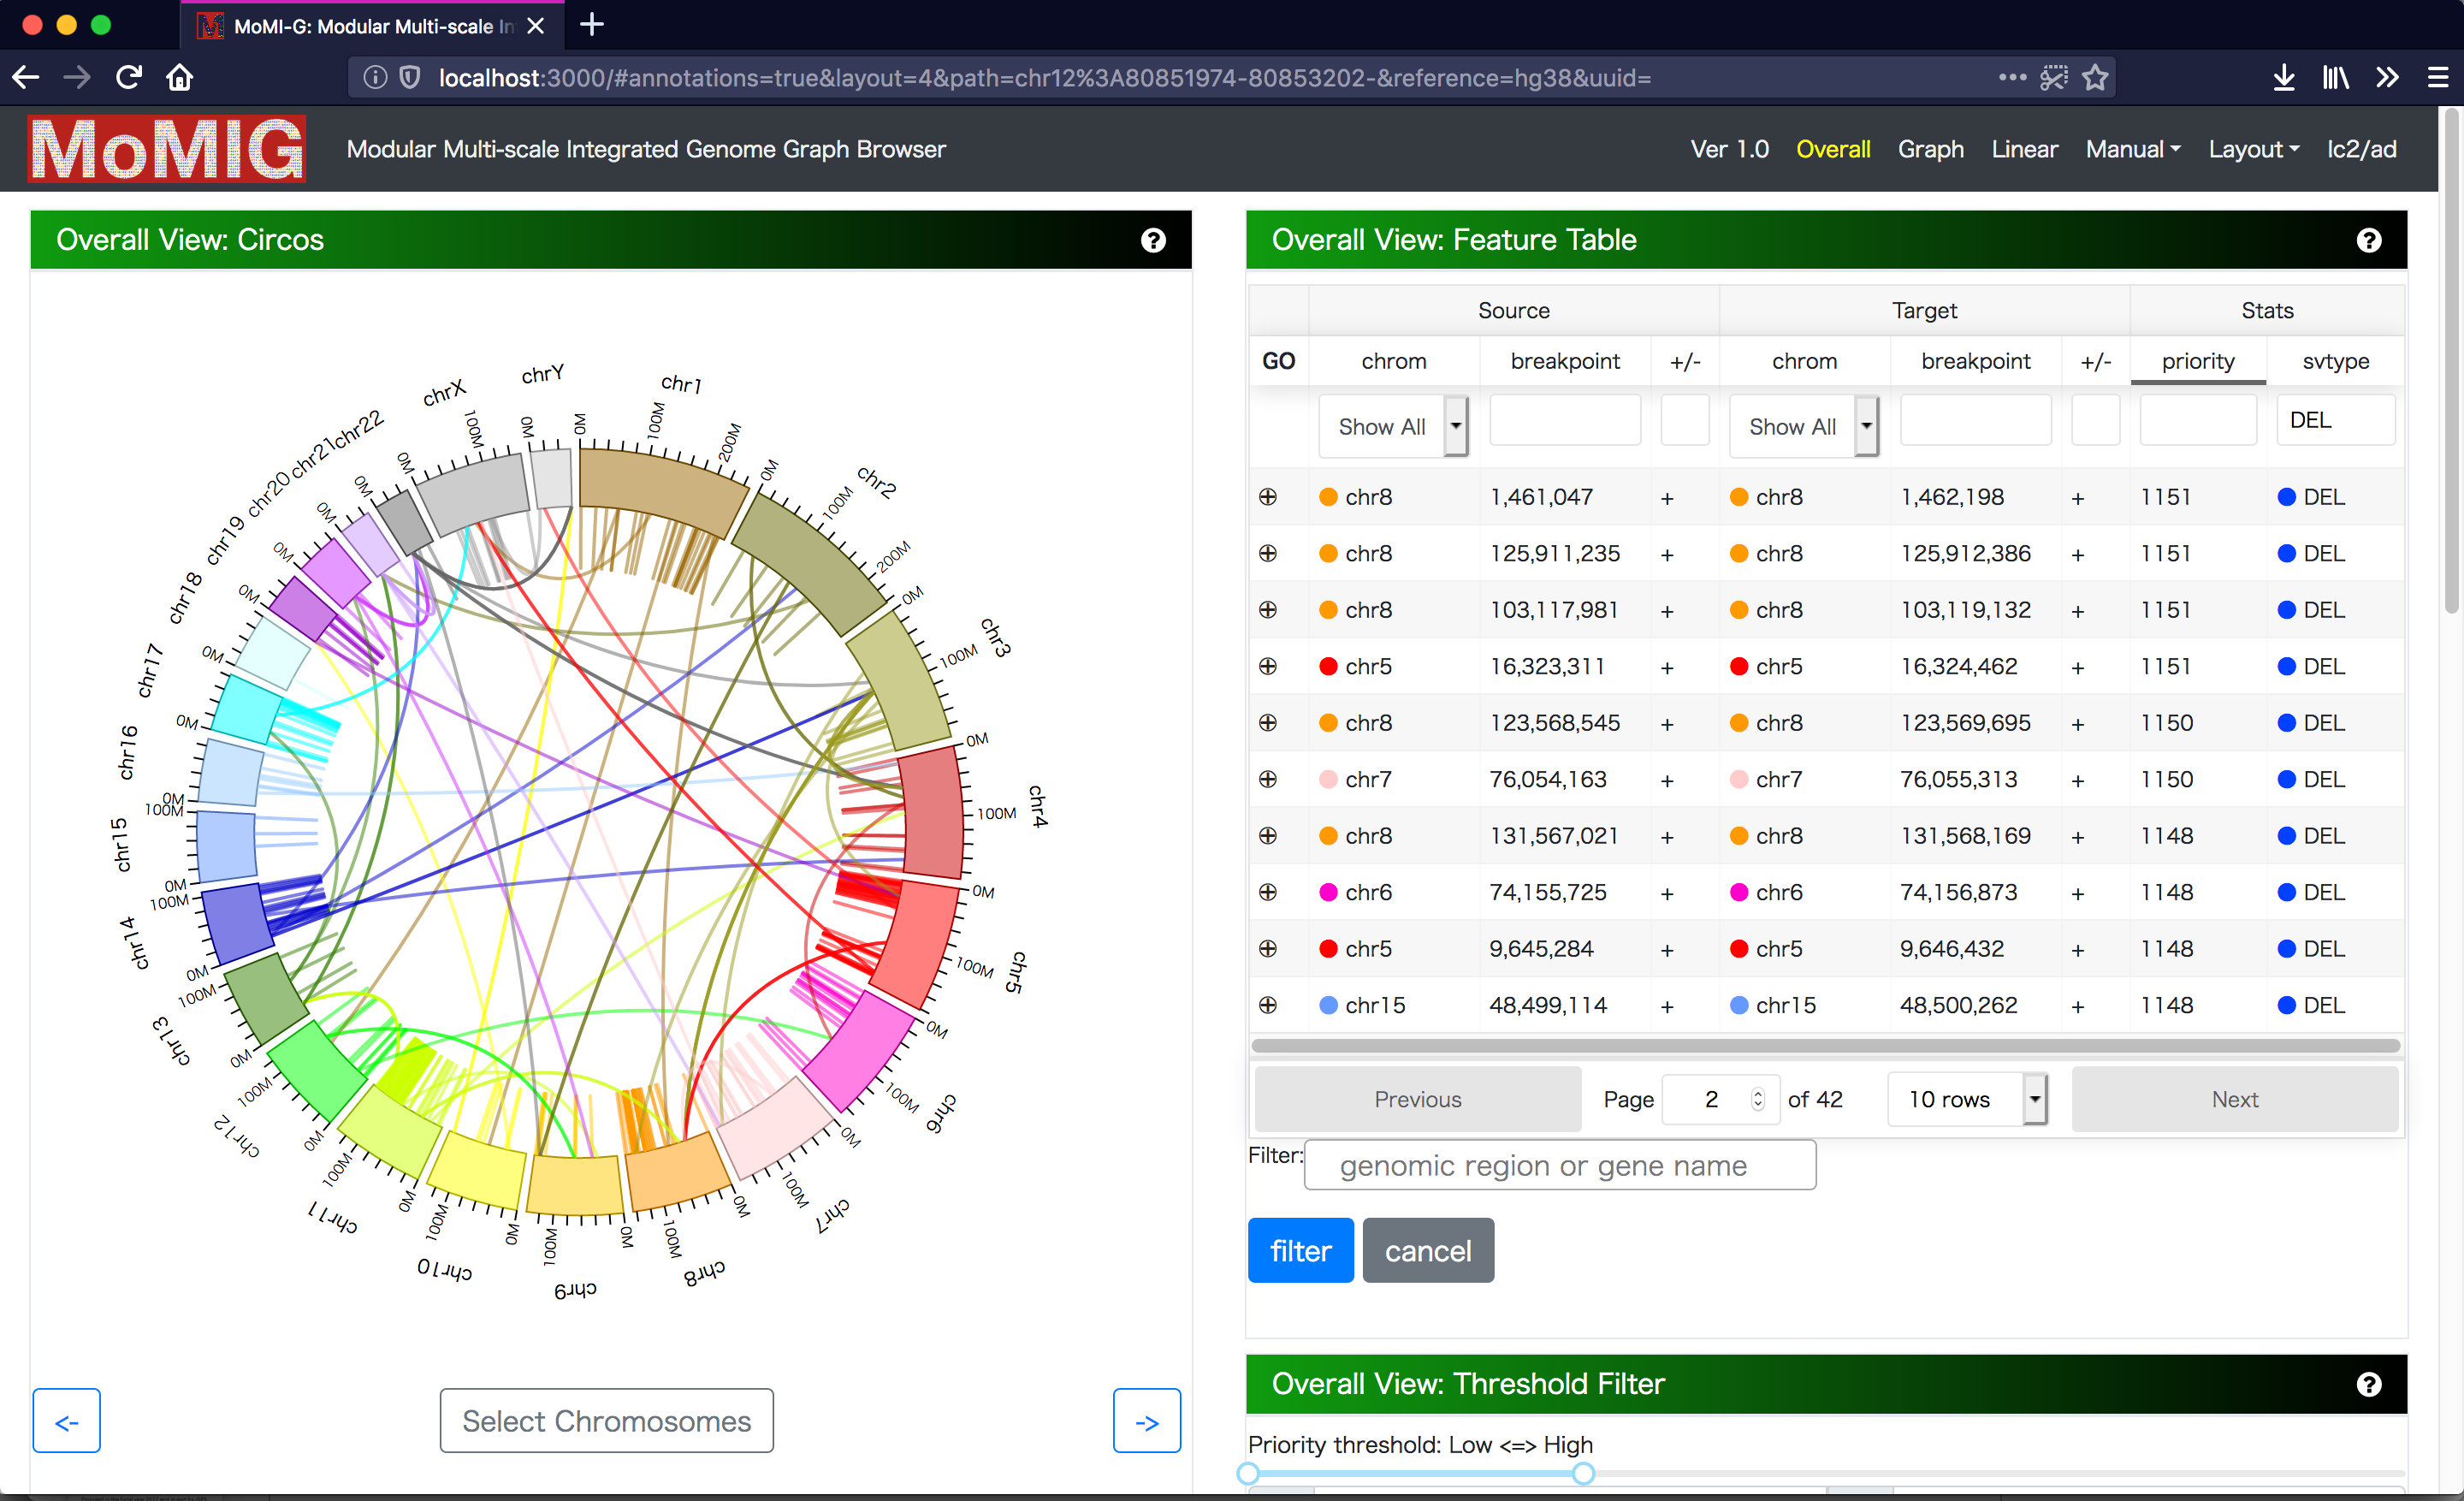
Manual screening for SV candidates is still important because of high false positive rate of SV calling, but it is time-consuming so that SVs should be filtered by certain criteria for manual screening. There are two view components to select SVs from candidates. The first view components is Circos, which aligns chromosomes as a circular layout. Thick arcs are chromosomes, and a line connecting to thick arcs indicates a SV. Because Circos enables us to choose and rotate chromosomes, we can focus on the subset of chromosomes. Circos is a suitable for visualizing the distribution of SVs and inter-chromosomal variations as lines. Second, Feature Table shows chromosome names, coordinates, and strand, enabling us to select SVs. We can sort and filter Feature Table by SV type, coordinates, or gene name. We can select a SV from both components.
Threshold Filter
Threshold Filter has two use cases. First, one can toggle checkboxes to select whether to show inter-chromosomal SVs and/or intra-chromosomal SVs. Second, one can filter SVs by using a slider based on the custom priority (possibly given by SV callers) of each SV.
Interval Card Deck
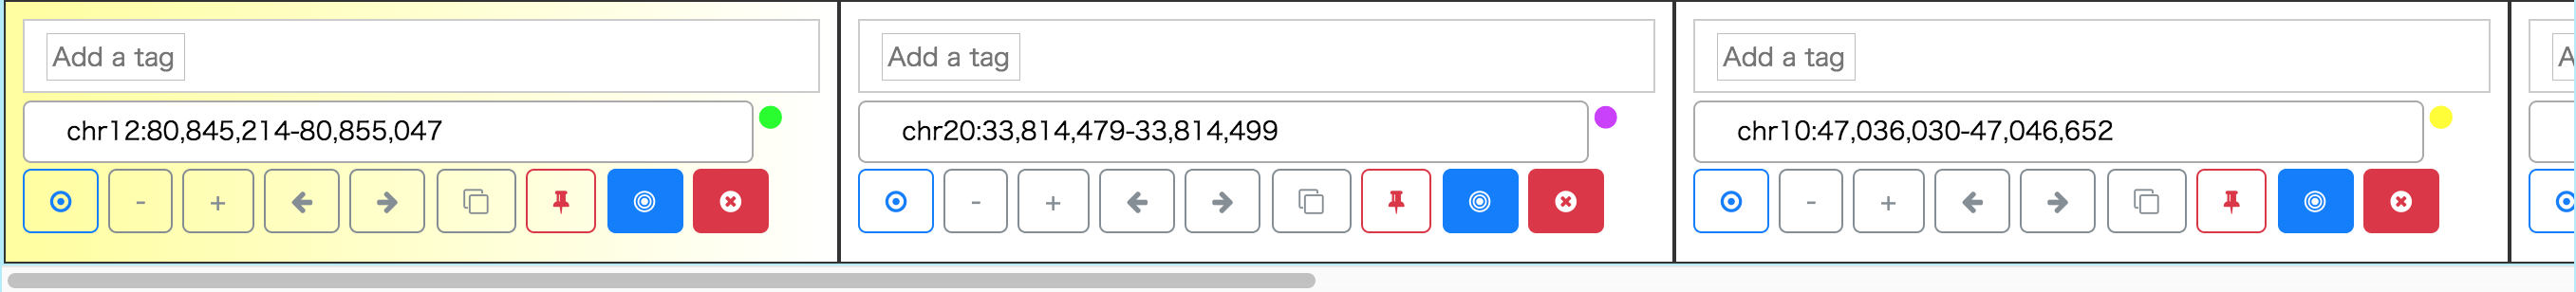
After you select SVs using Feature Table or Circos Plot, the listed variants are stacked on Interval Card Deck at the bottom of the window. In Interval Card Deck, intervals are displayed as cards, and the interval of the top (leftmost) card of the deck is shown on SequenceTubeMap. Each card can be dragged, and the order of cards can be changed. If one double-clicks on a card, the card moves to the top of the deck. Also, a card can be locked to avoid unintended modification or disposal, and the gene name can be input with autocompletion for specifying the interval of a card.
Shortcut keys
- Option/Alt + d -> Delete the head of the deck
- Option/Alt + s -> Keep the card, and move to the bottom of the deck
SequenceTubeMap
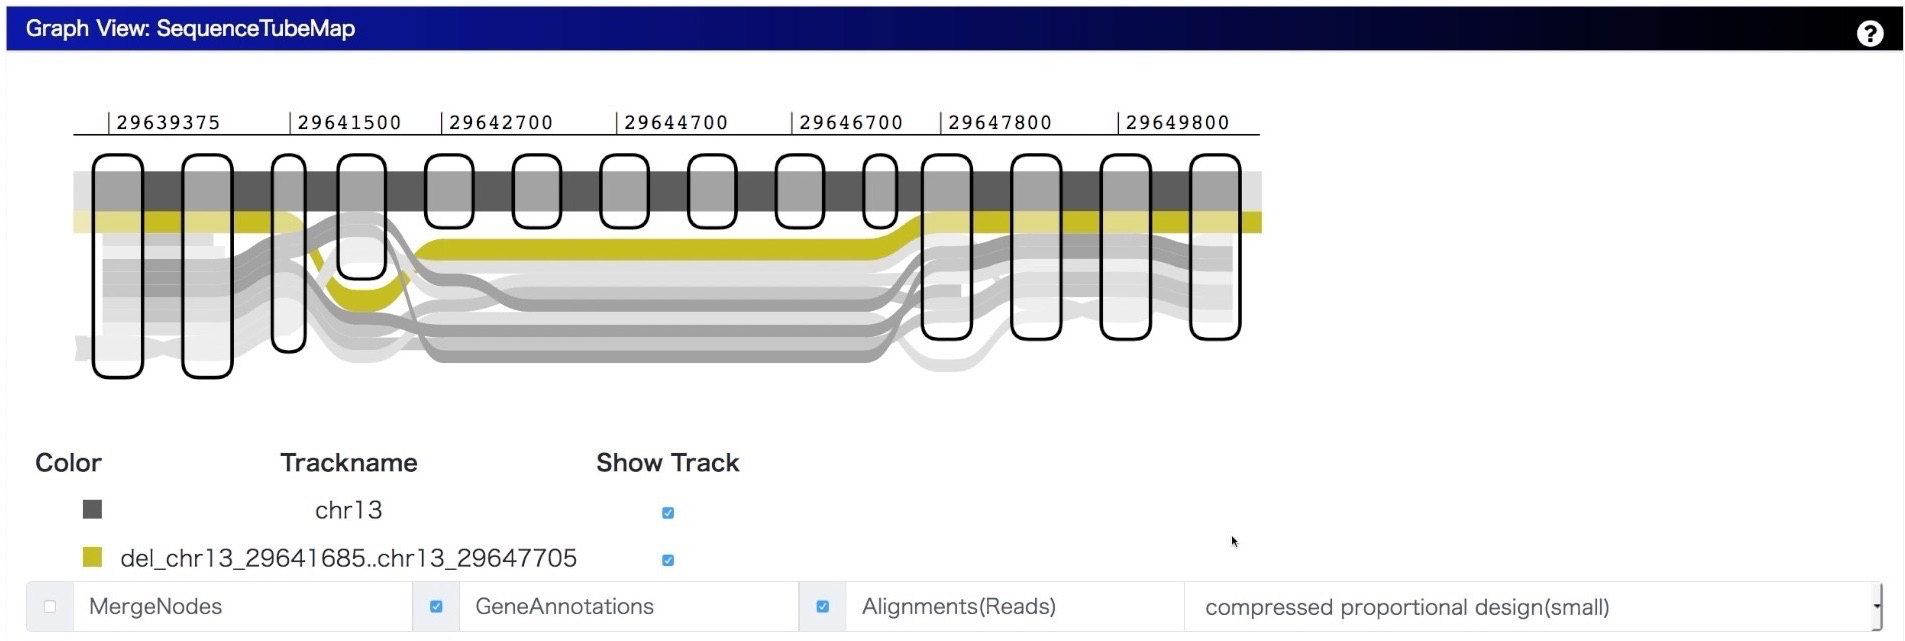
We integrate SequenceTubeMap into MoMI-G with modifying the original implementation so that it can visualize a variation graph converted from SVs for showing the difference between a reference genome and a personal genome. Because there are many types of paths in variation graph, we categorized them for assigning different design as follows:
- Chromosome Path (thick, grayscale): A chromosome path is a chromosome in a reference genome; walking on the path provides us a full nucleotide sequence.
- Variant Path (colored): A variant path with a variation name represents a personal genome.
- Gene Path (thin, colored): A gene path is for gene annotation. Exons are shown as a path with a darker color, and introns are shown as that with a lighter color.
- Annotation Path (thin, grayscale): An annotation path is for user-definable bigBed annotations such as repeats. If you have a GFF3 or BED file, you can easily convert into bigBed file.
- Read Alignment (thin, grayscale): Read alignments aligned on the graph or lifted over from the original alignments to a reference genome.
A sequence graph as a bi-directed graph composed of a set of multiple DNA sequences as nodes and the corresponding end-to-end connections as edges has the ability to describe duplications, indels and inversions as loops or branching and merging against a reference genome.
Annotations
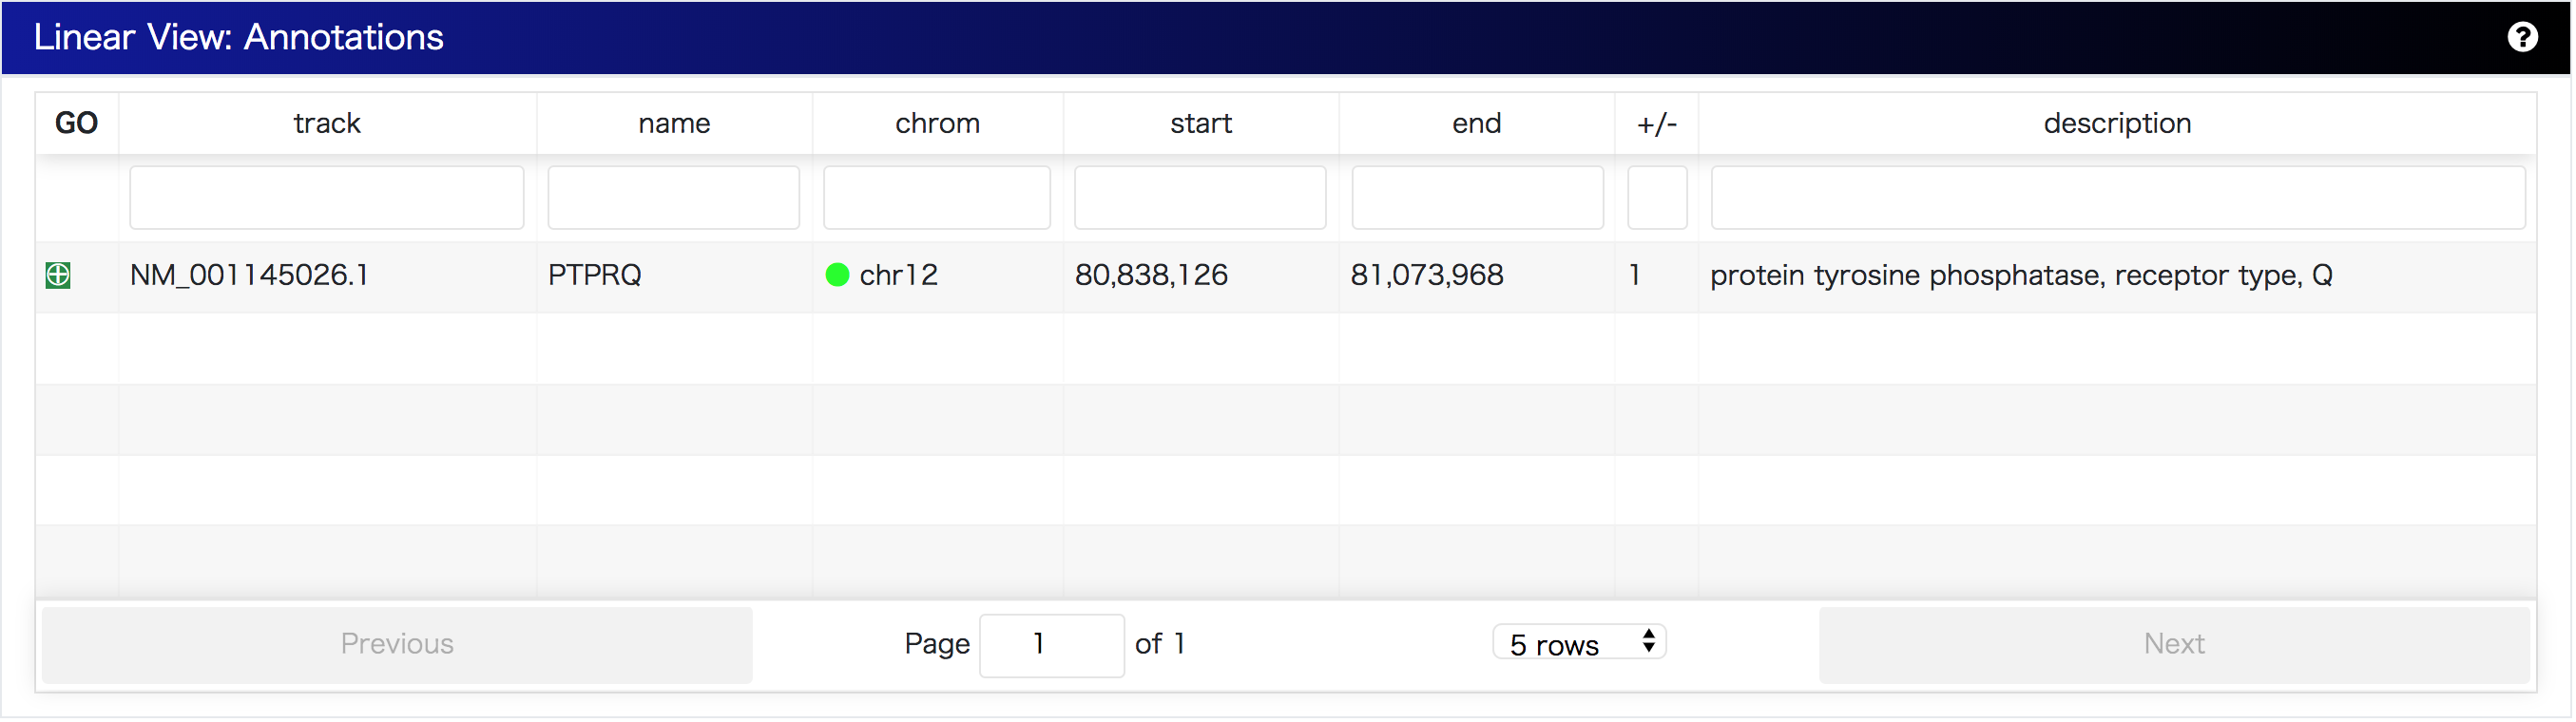
Gene annotations retrieved from Ensembl or names of the region described in bigbed format are listed on Annotation Table. Annotation table shows all annotations that are displayed on the SequenceTubeMap. Moreover, annotations can be downloaded as a BED file.
Ideally, MoMI-G provides annotations on variation graphs. However, annotations available in public databases are for the linear reference genome. MoMI-G can display annotations in bigWig/bigBed formats. In particular, for human reference genomes, GRCh19/hg37 and GRCh38/hg38, MoMI-G provides an interface for retrieving Ensembl gene annotations from the Ensembl SPARQL endpoint (Jupp et al. 2014) via SPARQList REST API (https://github.com/dbcls/sparqlist). The orientation of genes is shown in the legend of SequenceTubeMap. Further, if one clicks on a gene name, the website of the gene information in TogoGenome (Katayama et al. 2019) opens.
Linear Genome Browser
To provide a compatible view of a selected genomic region, we integrated Pileup.js (Vanderkam et al. 2016) into MoMI-G.